Next: Moving through a Mesh Up: Examples Previous: A Demo Script Contents Index
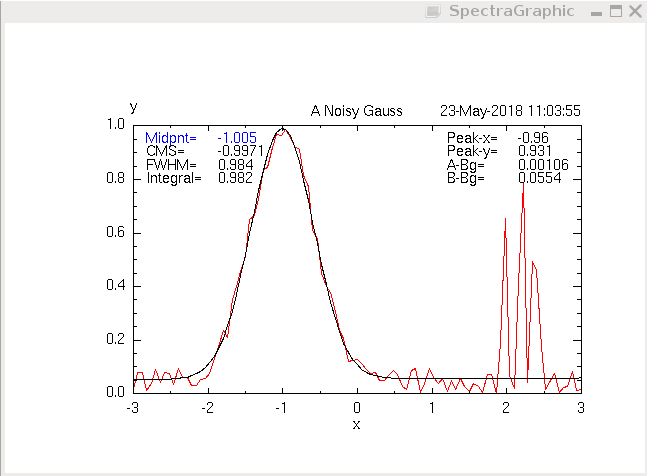
The following script creates a noisy Gaussian curve and creates another scan, a Gauss fit, on the basis of SSA_MIDPOINT, SSA_FWHM and SSA_INT.
Figure 4.2 displays the result. Notice that the noisy peak at the right part of the curve has been excluded by specifying limits for the SSA.
#!/usr/bin/env python

import Spectra
import math, time, random

START = -3
STOP = 3.
NP = 101
FWHM = 1.
MEAN = -1.

noisyGauss = Spectra.SCAN( name = "NoisyGauss",
                           start = START, stop = STOP,
                           np = NP, at = "(1,1,1)",
                           title = 'A Noisy Gauss',
                           colour = 2, xlabel = 'x', ylabel = 'y', date = True)

delta = (STOP - START)/(NP - 1)
x = START
sigma = FWHM/2.3548
for i in range( NP):
    noisyGauss.setX( i, x)
    y = 1./math.sqrt( 2.*math.pi*sigma**2)*math.exp( -(x - MEAN)**2/(2.*sigma**2))
    y += random.random()/10.
    if i > 80 and i < 92:
        noisyGauss.setY( i, y*8.)
    else:
        noisyGauss.setY( i, y)
    x += delta
    Spectra.gra_command( "autoscale/y")
    Spectra.gra_display()
    time.sleep(0.01)

Spectra.gra_command( "create/ssa=noisygauss/notext/x_min=-3/x_max=1 ssa_fit")
Spectra.gra_command( "display")

(sts, result) = Spectra.gra_yesno( "Enter Spectra")
if result == 1:
    Spectra.gra_input()