Next: Show Up: Commands Reference Section Previous: Shell Contents Index
> ssa scan_id
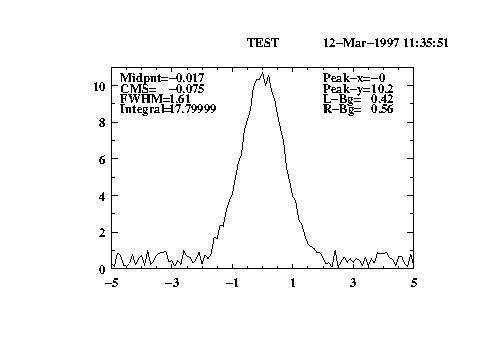
SSA_CMSThe parameters are calculated after a linear background has been subtracted.
SSA_FWHM
SSA_MIDPOINT between those points which are at 50% of the peak
SSA_INT integral
SSA_PREC no. of significant digits of the results
SSA_PEAK_X x-coord. of the highest point
SSA_PEAK_Y y-coord. of the highest point
SSA_A_BACK bg = ax + b
SSA_B_BACK
SSA_STATUS 1 for successful completion SSA_REASON 0: ok, 1: np < 6, 2: stbr, 3: no y(i) > 0., 4, 5: midpoint calc, 6: max outside x-range
The default of np is 10% of the data points but it is required to be in the range [2,20].
 ackground_subtraction
n=valx=val
!
! Example for SSA, simple scan analysis
!
 crea test -5 5 100
 calc test = 10*exp(-test*test) + random(test)
 ssa 1
 del 1.3 1.4
 display
 post/eps ssa_example.ps