Next: pyspLib Up: PySpectra Previous: Image attributes widget Contents Index
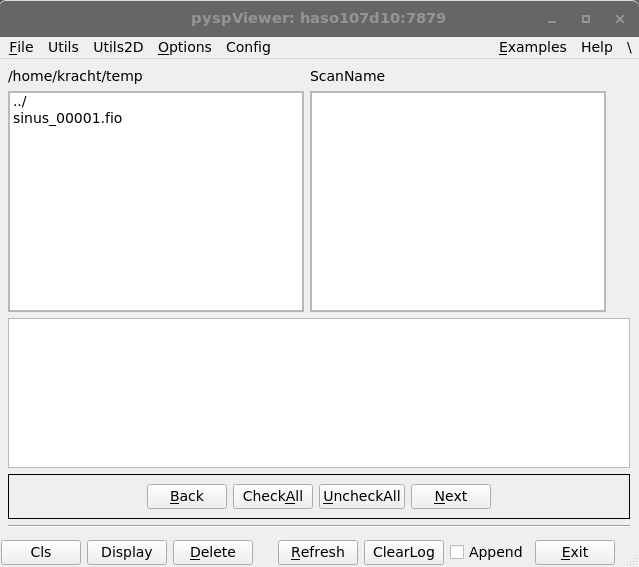
pyspViewer3.py, see 5, is an application based on PySpectra to display 1D data from ASCII ( .fio, .dat., .dat (numpy), .iint) and .nxs files.
The Viewer may receive data also via ZMQ, see 6.2.
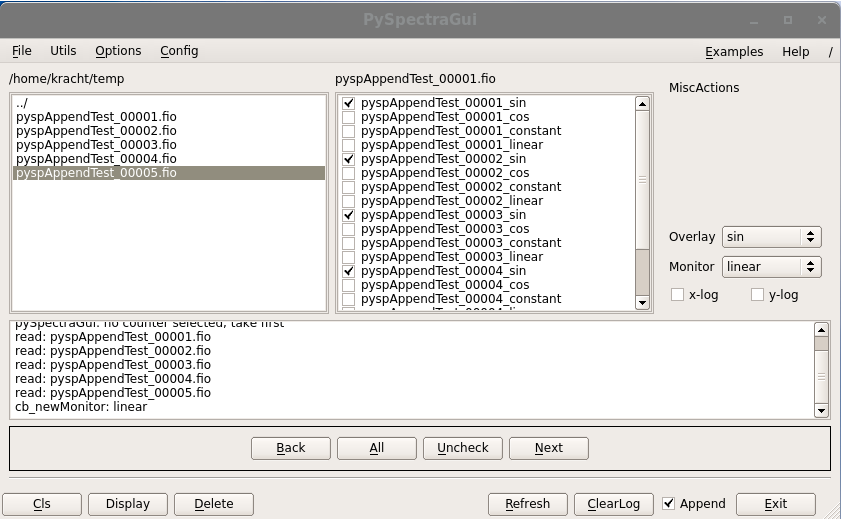
pyspViewer3.py has an append mode which can be used, e.g. to display plots of a certain counter across several .fio files, see 5. The Overlay combobox allows you to select a counter. All plots of this counter are displayed in overlay mode.
The Monitor combobox allows you to specifiy used for normalization.
When switching to the append mode, the internal data are deleted. This is because of a naming problem. As long as we are not in append mode, the GQEs do not need the file name in their names since data from one file only are displayed. This changes, if several files are read. The counter names may appear in several files. Therefore counter names are not sufficient to identify GQEs.
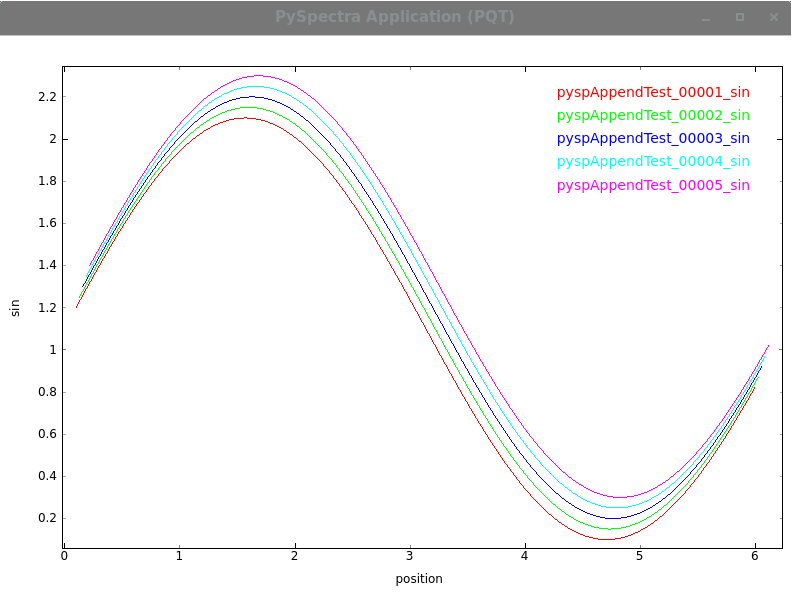
Notice, that you can create some .fio files to explore the append mode by clicking on Examples, createAppendFios. Press the Refresh button afterwards to make the newly created files visible in the files list box. After all of these files have been read, the graphics looks like this 5.