Next: toPyspLocal(), simulate a scan, Up: Graphics within the same Previous: Display data representing I/O Contents Index
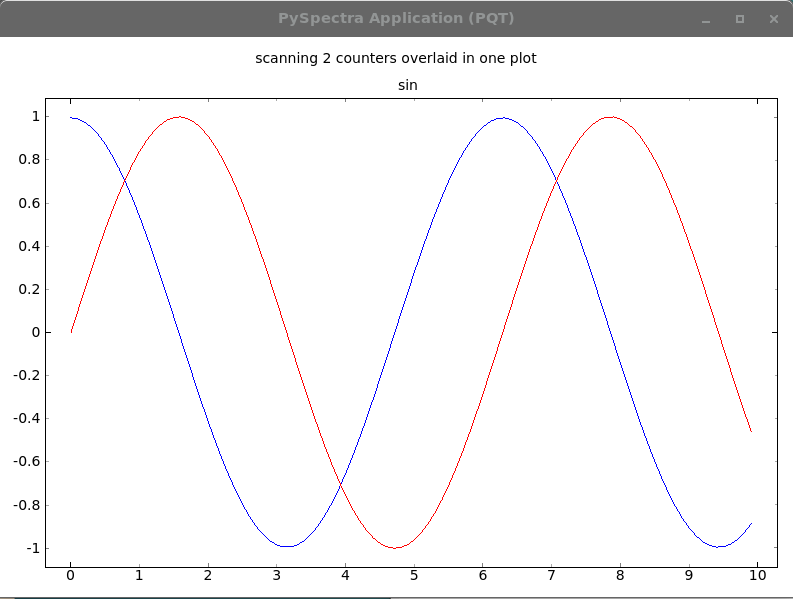
This piece of code simulates a scan with two plots overlaid. See figure 7.1.4
#!/usr/bin/env python3

import time, sys, random
import HasyUtils, PySpectra
import math

def main():

    MAX = 100
    pos = [float(n)/MAX for n in range( MAX)]

    sin = PySpectra.Scan( name = 'sin', x = pos, y = pos,
                          yMin = -1., yMax=1., autoscaleY = False)

    cos = PySpectra.Scan( name = 'cos', x = pos, y = pos, color = 'blue',
                          yMin = -1., yMax=1., autoscaleY = False)

    PySpectra.overlay( "cos", "sin")

    for i in range( sin.nPts):
        sin.setX( i, i/10. + 0.01)
        sin.setY( i, math.sin( i/10.))
        cos.setX( i, i/10. + 0.01)
        cos.setY( i, math.cos( i/10.))
        PySpectra.display()
        time.sleep( 0.1)

    print( "Press <space> to quit")
    while 1:
        PySpectra.processEvents()
        key = HasyUtils.inkey()
        if key == 32:
            return
        time.sleep( 0.1)

    return

if __name__ == "__main__":
    import PySpectra.pySpectraGuiClass

    app = PySpectra.QApplication(sys.argv)
    gui = PySpectra.pySpectraGuiClass.pySpectraGui( flagExitOnClose = True)
    gui.show()

    main()