Next: Simulate a scan, overlaid Up: Graphics done by pyspMonitor, Previous: Plot data from a Contents Index
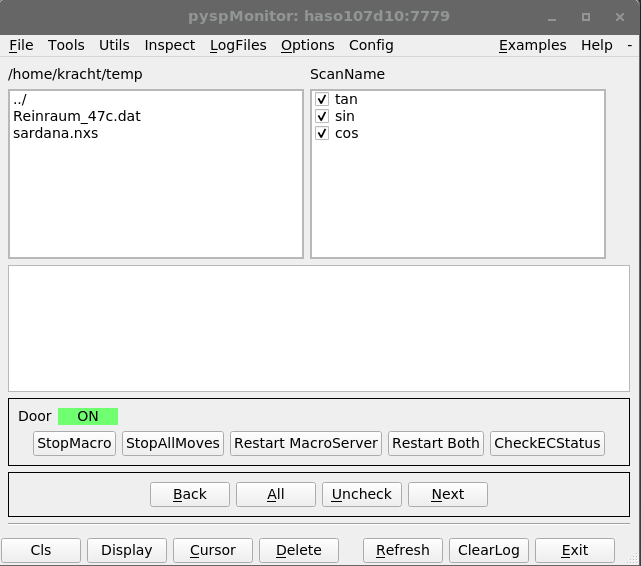
The following piece of code sends some data to the pyspMonitor, specifying some graphical attributes, see 7.2.6 and 7.2.6.
#!/usr/bin/env python3
#
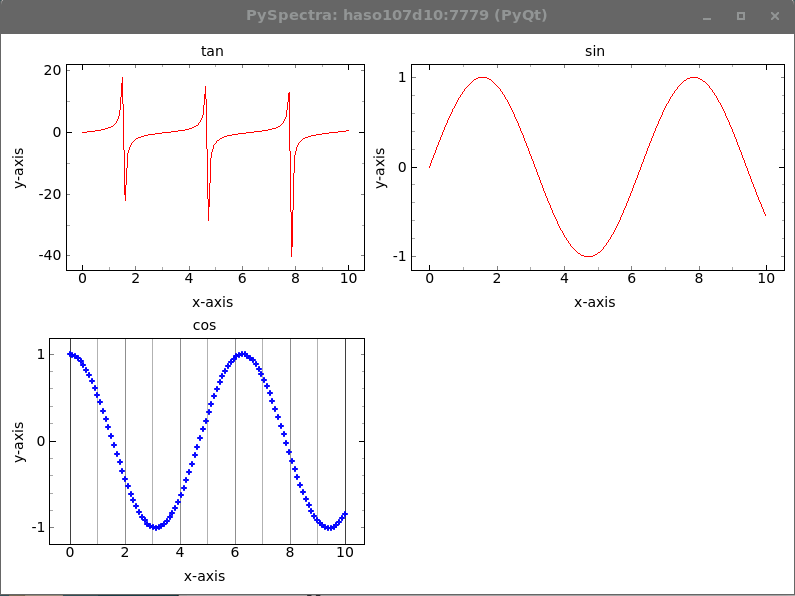
# the script sends 3 data structures, each with x- and y-column
# to the pyspMonitor and displays them.
#
import PySpectra, HasyUtils
import numpy as np
import time
def main():
(status, wasLaunched) = PySpectra.assertPyspMonitorRunning()
PySpectra.toPyspMonitor( { 'command': ['delete', 'cls']})
MAX = 100
x = np.linspace(0, 10, MAX)
tan = np.tan( x)
sin = np.sin( x)
cos = np.cos( x)
hsh = { 'putData':
{'gqes':
[ {'x': x, 'y': tan, 'name': 'tan'},
{'x': x, 'y': sin, 'name': 'sin'},
{'x': x, 'y': cos, 'name': 'cos',
'showGridY': False, 'symbolColor': 'blue', 'showGridX': True,
'yLog': False, 'symbol': '+',
'xLog': False, 'symbolSize': 5}]}}
PySpectra.toPyspMonitor( hsh)
PySpectra.toPyspMonitor( { 'command': 'display'})
print( "Press <space> to continue")
while 1:
key = HasyUtils.inkey()
if key == 32:
break
time.sleep( 0.1)
#
# if the pyspMonitor was launched by this script, kill it.
#
if wasLaunched:
hshRet = PySpectra.toPyspMonitor( { 'command': [ 'exit']})
return
if __name__ == "__main__":
main()