Next: Set the Attributes of Up: Set Previous: Set the Attributes of Contents Index
If row is omitted, col may run from 1 to
ncol nrow.
nrow.
Here are two examples to illustrate the function of the /AT qualifier. Both commands are equivalent
SPECTRA>set bpu1/v2
SPECTRA>set bpu1/at=(2,2,1,1)
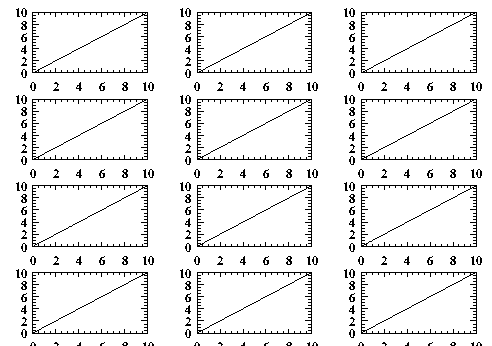
This example is not very impressive because no keystrokes are saved. But if you have to display several scans, you can place them on the screen with such a loop (output in section 15.3.69):
!
! This command file displays the usage of the /at= qualifier
! e.g.:
!
!   SPECTRA> run at_example.gra 3 4
!
 var ncol nrow

 if !gra_status()
   end
 endif

 del *.*

 for( i=1; i < (ncol*nrow + 1); i = i + 1)
  create/notext "test_"i 0 10 100
  set "test_"i/at=(ncol,nrow,i)
 endfor

 display
 post/eps/col/nocon at_example.ps
our=int_expr  varies from 1 to 10. The first comment
line can also be accessed by /com. During change only the first
comment line is visible, the others can be inspected by show id.
ne_at_0=int_expr in=int_expr irs irs mitive=int_expr
varies from 1 to 10. The first comment
line can also be accessed by /com. During change only the first
comment line is visible, the others can be inspected by show id.
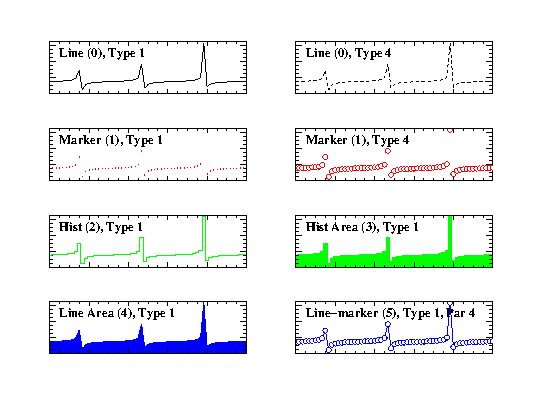
ne_at_0=int_expr in=int_expr irs irs mitive=int_expr 0 - LineIn case '5' is selected, SPECTRA draws markers on a line. The line type is determined by /type the marker type by bf /par.
1 - Marker
2 - Histogram
3 - Filled histogram
4 - Filled line
5 - Line and marker
A figure that demonstrates some primitive types can be found in section 15.3.69. Here is the code that created it.
  delete *.*

  crea/notex tn 0 10 60
  calc tn = tan(tn) + 40

  deact tn

  cop tn tn1
  set tn1/prim=0/v11/col=1
  create/text/string="Line (0), Type 1"/x=0.05/y=0.8 tn1

  cop tn tn2
  set tn2/prim=0/v12/type=4/col=1
  create/text/string="Line (0), Type 4"/x=0.05/y=0.8 tn2

  cop tn tn3
  set tn3/prim=1/v13/col=2/type=1
  create/text/string="Marker (1), Type 1"/x=0.05/y=0.8 tn3

  cop tn tn4
  set tn4/prim=1/v14/col=2/type=4
  create/text/string="Marker (1), Type 4"/x=0.05/y=0.8 tn4

  cop tn tn5
  set tn5/prim=2/v15/col=3/type=1
  create/text/string="Hist (2), Type 1"/x=0.05/y=0.8 tn5

  cop tn tn6
  set tn6/prim=3/v16/col=3/type=1
  create/text/string="Hist Area (3), Type 1"/x=0.05/y=0.8 tn6

  cop tn tn7
  set tn7/prim=4/v17/col=4/type=1
  create/text/string="Line Area (4), Type 1"/x=0.05/y=0.8 tn7
!
! par selects the marker type for line-marker
!
  cop tn tn8
  set tn8/prim=5/v18/col=4/type=1/par=4
  create/text/string="Line-marker (5), Type 1, Par 4"/x=0.05/y=0.8 tn8

!
! negative major tic mark factors suppress
! the tic mark numbers
!
  set */x_maj=-4/y_maj=-4

  display
  post/eps/col/nocon
factor=float_expr max(y) and likewise y_min.
Y_min will not be set to negative numbers this way.
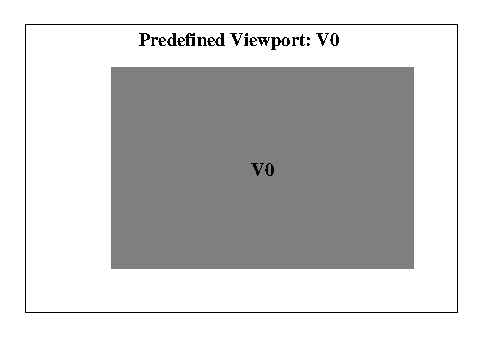
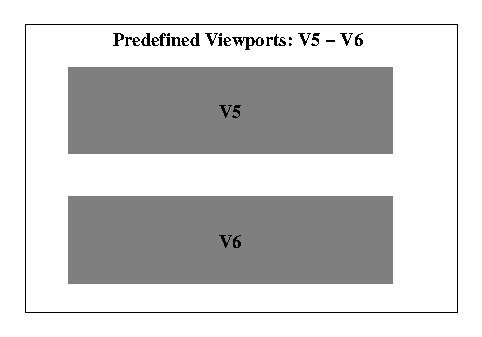
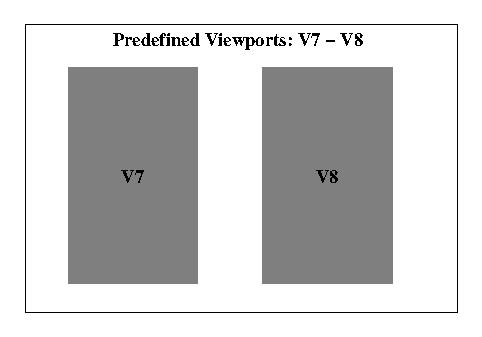
ze=float_expr pr=int_expr xis=text_expr xis=text_expr x=float_expr n=float_expr x=float_expr n=float_expr iew=float_expr iew=float_expr iew=float_expr iew=float_expr The size of the viewport is specified in graphical coordinates, from 0 to 1.
/v0 default viewport
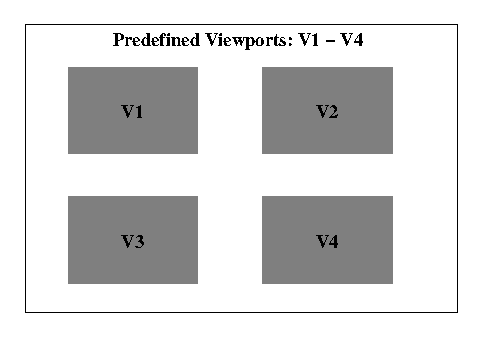
/v1 upper left corner
/v2 upper right corner
/v3 lower left corner
/v4 lower right corner
/v5 upper half
/v6 lower half
/v7 left half
/v8 left half
The predefined viewports are displayed in 15.3.69,
![[*]](crossref.png) .
.
ormat=text_expr ormat=text_expr The format specification has to be done according to the syntax of the language C (e.g.: Floating point representation with a mantissa of four digits: "%7.4f", or an exponential representation, again with a mantissa of four digits: "%7.4e". Integer valued numbers are printed with : "%d".)
og=int_expr og=int_expr 0 - Linear 1 - LogarithmicLogarithmic scales should have maj_tic = 9 and the tic distance set to the lower window limit.
ff=int_expr ff=int_expr Example: Suppose there is data that varies from 880 to 2000. The tic marks should start at 900, the first big tic mark at 1000. This is accomplished by setting x_tic=100, x_tic_off=20, x_maj_off=1.
hift=float_expr hift=float_expr
ff=float_expr ff=float_expr
> set bpu1/y_log=1/y_maj=9/y_min=0.1/y_tic=0.1