Next: Display data representing I/O Up: Graphics within the same Previous: Very simple, display some Contents Index
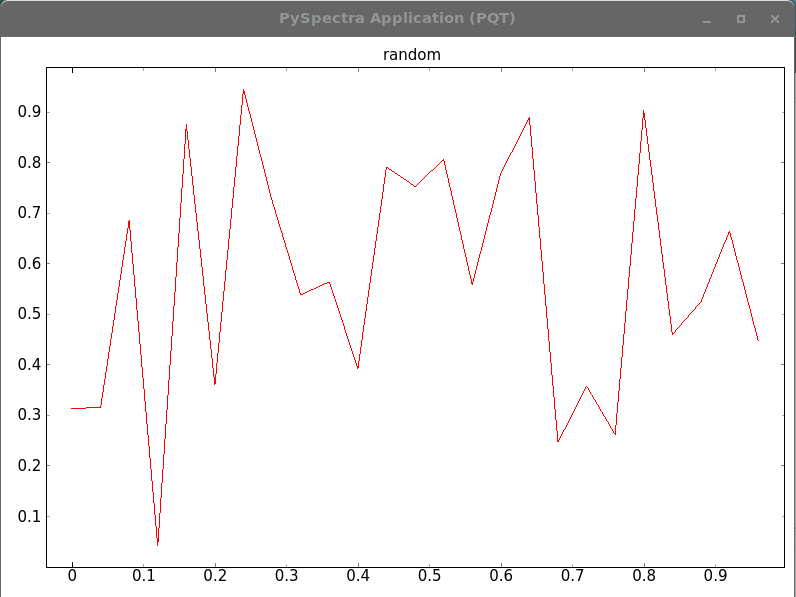
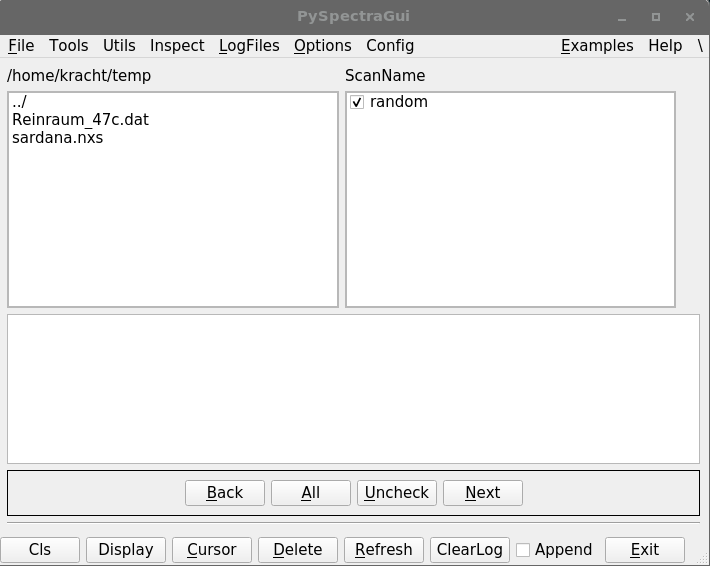
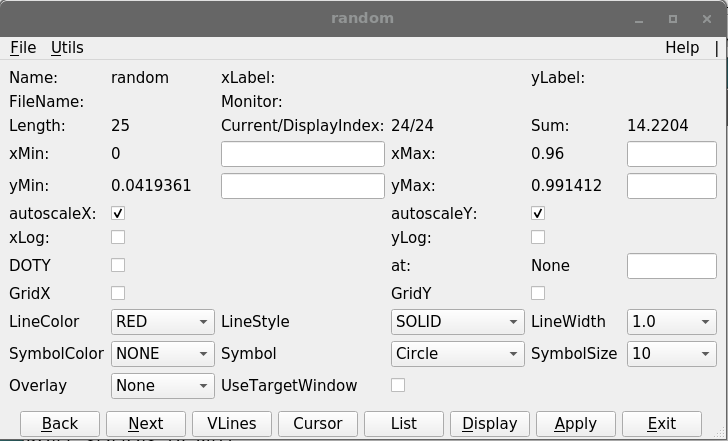
The following piece of codes opens a graphical window (7.1.2), the pysp main widget (7.1.2) and displays some data. The PySpectra main widget allows you to tune the attributes (7.1.2), make other changes to the plot, create a hardcopy, etc.
#!/usr/bin/env python3

import time, sys, random
import HasyUtils, PySpectra

def main():

    MAX = 25
    pos = [float(n)/MAX for n in range( MAX)]
    rd = [random.random() for n in range( MAX)]

    PySpectra.Scan( name = 'random', x = pos, y = rd)
    PySpectra.display()

    print( "Press <space> to quit")
    while 1:
        PySpectra.processEvents()
        key = HasyUtils.inkey()
        if key == 32:
            return
        time.sleep( 0.1)

    return

if __name__ == "__main__":
    import PySpectra.pySpectraGuiClass

    app = PySpectra.QApplication(sys.argv)
    gui = PySpectra.pySpectraGuiClass.pySpectraGui( flagExitOnClose = True)
    gui.show()

    main()