Next: Cursor widget Up: pyspMonitor Previous: pyspMonitor Contents Index
pyspMonitor3.py listens to a Sardana Door and automatically displays the 0D and 1D data. The Door delivers data when Macros are executed on the MacroServer, invoked from spock or by executing runMacro on a Door. The program is launched by:
$ pyspMonitor3.py
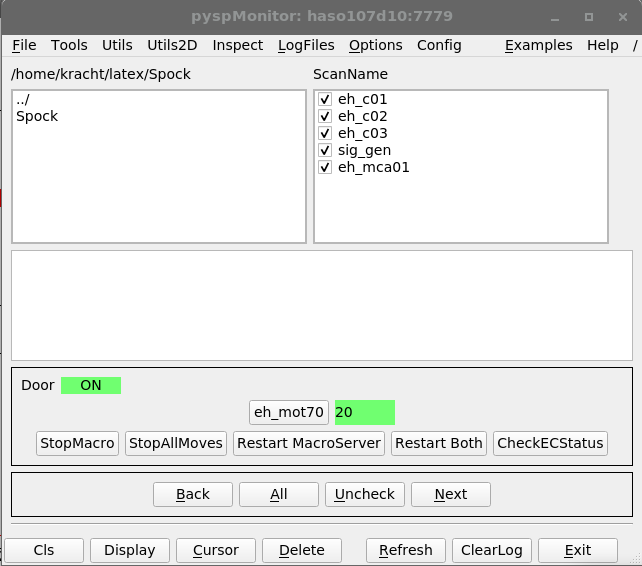
Figure 4.1 shows the main widget. The checkbox in front of the GQE names control whether the GQEs are displayed.
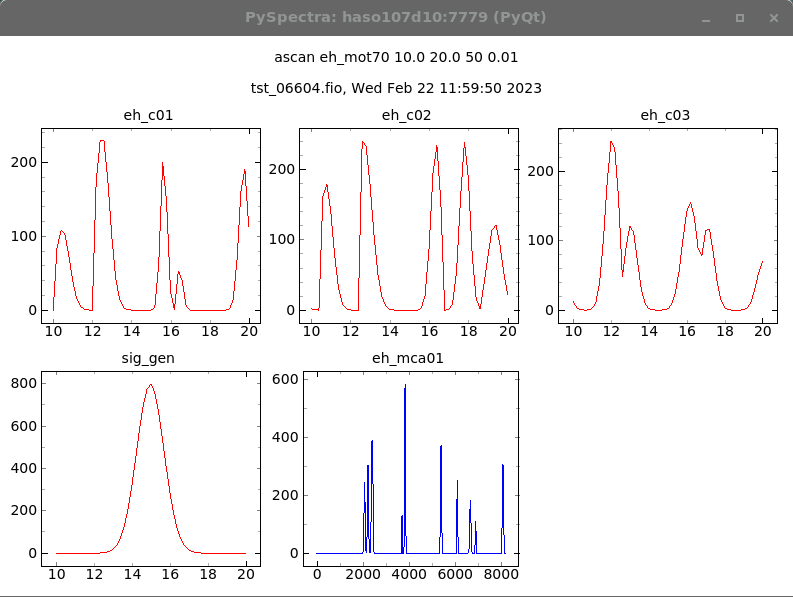
Figure 4.1 shows a typical graphical output displaying 0D and 1D data. It uses pyqtgraph, allowing you to zoom-in and so.
In addition to the display functionality, pyspMonitor3.py can be used for other tasks. The following list is not complete.
$ pyspMonitor3.py

$ pyspMonitor3.py --help
usage: pyspMonitor3.py [-h] [-d DOORNAME] [-m] [-n] [-p ZMQPORT]
                      [--fs FONTSIZE]

PySpectra Sardana Monitor

optional arguments:
  -h, --help     show this help message and exit
  -d DOORNAME    name of a door, e.g.: pyspMonitor3.py -d p99/door/haspp99.01
  -m             graphics from matplotlib, def.: pyqtgraph
  -n             do not receive data from a door, instead toPyspMonitor() is
                 used
  -p ZMQPORT     zmq port for toPyspMonitor(), def.: 7779
  --fs FONTSIZE  font size

Examples:
 pyspMonitor3.py
   the default command

 pyspMonitor3.py -p 7780
   if the default zmq port (7779) is already used

 pyspMonitor3.py -d p99/door/haspp99.02
   connect to a specific door

 export TANGO_HOST=haspp77:10000 && pyspMonitor3.py -d p77/door/haspp77.01
   imports data from a door running on another TANGO_HOST

 pyspMonitor3.py -d firstDoor
 pyspMonitor3.py -d secondDoor
 pyspMonitor3.py -d thirdDoor